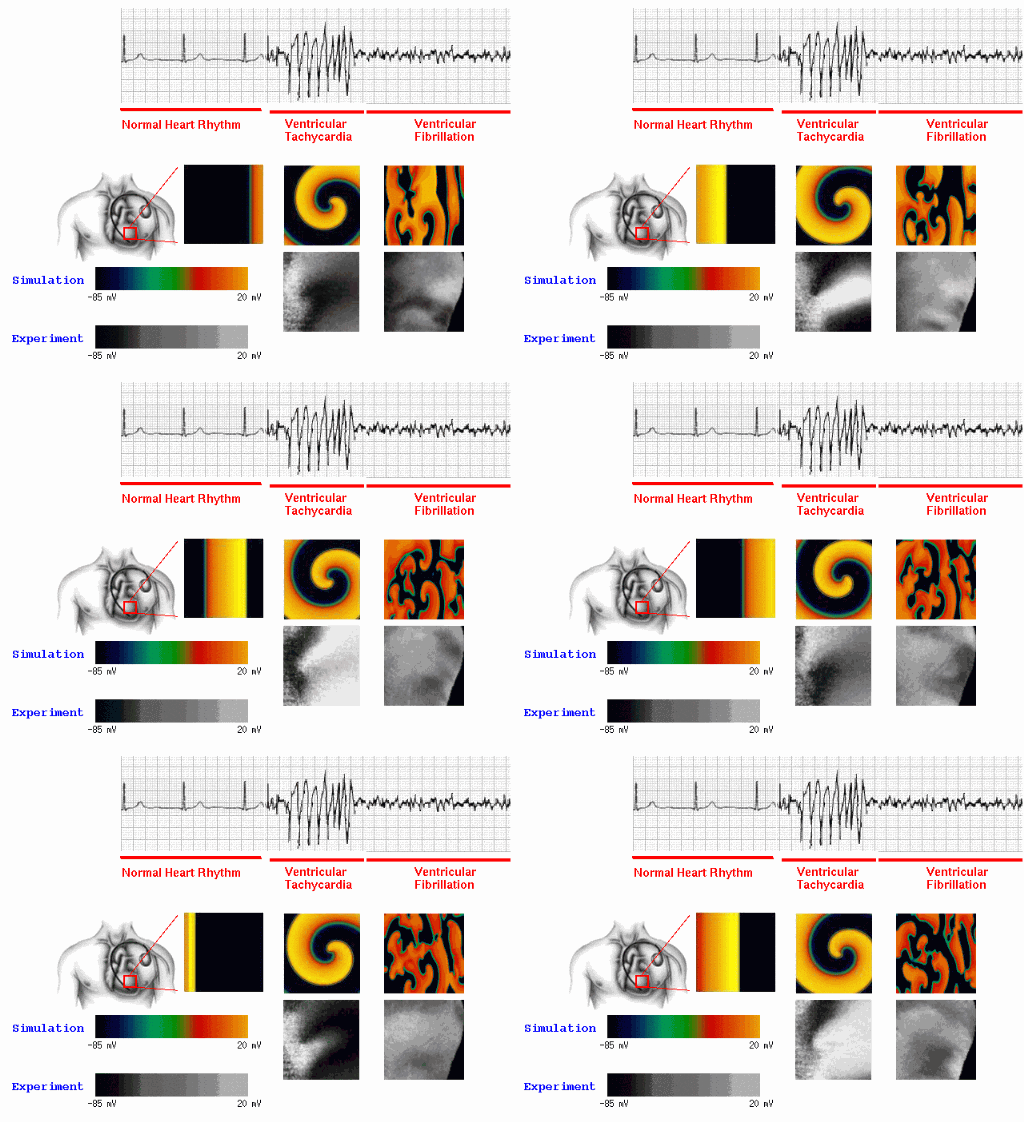
In this section of the website, you can visualize the electrical activity of some of the complex cardiac arrhythmias explained in the cardiac rhythms section.
Optical mapping uses voltage-sensitive dyes that fluoresce in proportion to the membrane potential and allows to visualize and to record the electrical waves in the heart both during normal activations and during arrhytmias suchas the ones described in the arrhythmias secctions. optical mapping data can be compared with numerical simulations and used to guide and make more accurate mathematical models of cardiac cells with correct cell dynamics.

(b) A spiral wave of electrical activity generated in the heart with a period of about 0.2s can produce the fast oscillations characteristic of an arrhythmia called tachycardia, which often directly precedes the onset of fibrillation.
(c) Multiple spiral waves produced by the breakup of a spiral wave can lead to the fast irregular oscillations characteristic of fibrillation.
In the following pages the electrical waves are visualized using a color map that relates to the intensity of the signal which is proportional to the propagating action potential (described in the modeling secction) in the tissue.
